

This article is not written to be a step-by-step guide on creating custom status display, but instead focuses on a general approach. To follow along, you will need a basic level of programming knowledge. Familiarity with any programming language will do, as I will look into where and how to find the information we need for our goal. That being said, I also included is a link to the project I wrote along this article, which is written in the Go language.
If you have a ODROID CloudShell or CloudShell 2 case, you most likely have been using the cloudshell-lcd package, and have seen how useful that information display is. My problem came from wanting more information to be displayed, and from the small text being hard to read on the CloudShell from across the room. I wanted something more visual that could be read quickly and instantly understood. Progress bars, seemed like a good enough answer, so there I went. Most of the information necessary can be gathered by reading files in /proc on Linux, this could be accomplished with the linproc filesystem.
CPU Usage
Knowing that I wanted CPU, RAM, swap, networking, and disk statistics, I had a good place to start. Linux has made CPU usage, and most other stats, pretty easy as the information available in ‘/proc/stat’. More information is available at http://bit.ly/2jGKrRd. The first line gives us an aggregation of all the core statistics, with the following fields represented:
* user: Time spent in user mode * nice: Time spent in user mode with low priority (nice) * system: Time spent in system mode * idle: Time spent in the idle task. * iowait: Time waiting for I/O to complete. However, unreliable see the proc(5) man page for details. * irq: Time servicing interrupts * softirq: Time servicing softirqs * steal: Stolen time, time spent in other operating systems, in virtualization workloads * guest: Time spent running a virtual CPU for guest OS's (virtual workloads) * guest_nice: Time spent running a niced guest (virtual workloads)
Since space is at a premium on our display, we're only worrying about the first line, since it gives us our total stats. The following command will print out only the first line from ‘/proc/stat’.
$ head -n1 /proc/stat
 cpu 817905 909158 818680 133949276 2463 0 11128 0 0 0
To gather our statistics, we need a delta, that mean we need to read the value, wait for a period of time, for instance 1 second, and then read another. The difference between these values tells us how busy the system was for that second. The numbers will be odd, they won't seem like timestamps, and there is a good explanation for that, since they aren't. They're a counter for what's called "jiffies". For finer grained measurements, such as actual processor time spent on each attribute, one would need to find the static value HZ from the kernel. This command should get that value.
$ zgrep -i hz /proc/config.gzThis value is roughly the number of ticks per second, which is 1000 on most intel compatible platforms, but embedded systems often use 100. For our purposes, we can just get a measurement of process vs work time:
$ head -n1 /proc/stat ; sleep 1; head -n1 /proc/stat
 cpu 885034 1050588 935349 152731137 2546 0 12670 0 0 0
 cpu 885039 1050588 935350 152731533 2546 0 12670 0 0 0
$ tot1=$((885034 + 1050588 + 935349 + 152731137 + 2546 + 12670))
$ wrk1=$((935349 + 152731137 + 2546 + 12670))
$ tot2=$((885039 + 1050588 + 935350 + 152731533 + 2546 + 12670))
$ wrk2=$((935350 + 152731533 + 2546 + 12670))
$ tot3=$((${tot2} - ${tot1}))
$ wrk3=$((${wrk2} - ${wrk1}))
$ python -c "print((${wrk3}.0 / ${tot3}.0) * 100.0)"
RAM and Swap Usage
RAM statistics can be pulled from multiple sources. For instance, one could read them from ‘/proc/meminfo’. However, I chose not to because the values are in kilobytes instead of bytes. I chose a direct syscall rather than opening a file with the resulting file processing. Below is a small program written in Go using CGO instead of the syscall package, which I did for simplicity. It uses “sysconf(3)”, which can gather quick memory statistics, for more information, visit http://bit.ly/2jBNXfI.
package main

// #include
 import "C"
 import "fmt"

func main() {
 maxRam := int64(C.sysconf(C._SC_PHYS_PAGES) * C.sysconf(C._SC_PAGE_SIZE))
 freeRam := int64(C.sysconf(C._SC_AVPHYS_PAGES) * C.sysconf(C._SC_PAGE_SIZE))
 usedRam := (maxRam - freeRam)
 ramPercUsed := (float64(usedRam) / float64(maxRam)) * 100.0
 fmt.Println("total =", maxRam)
 fmt.Println("free =", freeRam)
 fmt.Println("used =", usedRam)
 fmt.Println("(used / total) * 100 =", ramPercUsed)
 }
This method gives you both the amount of used and available memory pages. This, multiplied by the system's page size constant _SC_PAGE_SIZE, gives us the amount of used and available memory. This statistic was easy, and with less "moving parts" than the CPU usage.
Swap statistics, on the other hand, can easily, reliably, and with no additional calculation overhead, be read out of the “/proc/swaps” file. It looks like this:
$ cat /proc/swaps
 Filename Type Size Used Priority
 /dev/sda2 partition 8388604 0 -1
 ...
This is pretty self explanatory, and the size and used columns are both measured in bytes.
Network Usage
This one can be fun. First, you need to know what network device you want to measure. You can find this list in multiple ways. One way would be to parse “ifconfig -a” or “ip addr” output. This is a bit cumbersome when compared to other methods such as listing the contents of “/sys/class/net/”. On my system, this returns “eth0”, “lo”, and “wlan0”. Getting the interface speed is as simple as using the following command:
$ cat /sys/class/net/eth0/speed
 1000
The next step is to measure our throughput. We will take periodic values like we used for measuring CPU usage. In this article, I'll be focusing on the eth0 interface, and the data I'm after can be found in “/sys/class/net/eth0/statistics/rx_bytes” and “/sys/class/net/eth0/statistics/tx_bytes”. They have a format like the following, which easily gives us basic network metrics:
$ cat /sys/class/net/eth0/statistics/rx_bytes
 324429106
Disk Usage
There are two kinds of disk usage we might want to measure here: throughput and capacity. The first can be pulled similarly to many of the other statistics we've gathered so far from the “/proc” directory. The file “/proc/diskstats” will contain data similar to the following:
8 0 sda 52410 323 1699276 29193 450364 121816 4772512 41466 0 19286 70376
 8 1 sda1 101 0 6594 93 1 0 8 0 0 70 93
 8 2 sda2 46 0 4424 43 0 0 0 0 0 33 43
 8 3 sda3 52238 323 1686170 29020 448708 121816 4772504 41316 0 19113 70040
 8 16 sdb 81 0 4184 33 0 0 0 0 0 16 33
The fields are defined in the Linux kernel source tree in the file “Documentation/iostats.txt”:
- Major number
- Minor number
- Device name
- Reads completed
- Reads merged
- Sectors read
- Time spent reading (in ms)
- Writes completed
- Writes merged
- Sectors written
- Time spent writing (in ms)
- Iops currently in progress
- Time spent in iops (in ms)
- Weighted time spent in iops (in ms)
It's easy to see how to find the throughput measurements, but what about disk capacity? One way to do it is with a bit of C (or Go, Rust, Nim, Python, Ruby, or whatever else that can interface to C) and the “statfs(2)” syscall. Go has a syscall package, as I mentioned earlier, that I'm going to use again for this particular example:
package main

import (
 "fmt"
 "syscall"
 )

func main() {
 stat := &syscall.Statfs_t{}
 syscall.Statfs("/", stat)
 fmt.Println("Total space:", (stat.Blocks * uint64(stat.Bsize)))
 fmt.Println("Free space :", (stat.Bfree * uint64(stat.Bsize)))
 }
Saving that code to file as “disk.go” and running it will give you:
$ go run disk.go
 Total space: 87352057856
 Free space : 35807154176
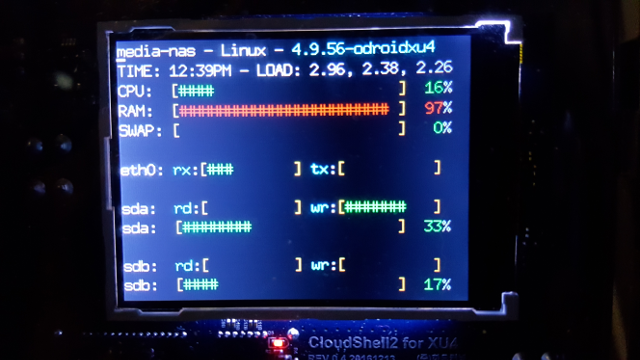 The new LCD status display on the CloudShell
This project was a fun one, since I got to play with several new things like CGO! I hope you've gotten something out of it as well. The project I alluded to in the beginning can be found on GitHub at http://bit.ly/2hEUa6B.
Be the first to comment