

In this article we're going to look at a Home Assistant companion - AppDaemon (https://goo.gl/mxvm6W). This is a framework that allows you to build your own Python applications and have them react to events and interact directly with Home Assistant. It gives you the flexibility to write complex automations directly in Python, and if you have a programming background, this will be easier than writing long automations in YAML. An added bonus is that it comes with a framework to build pretty-looking dashboards.
AppDaemon can be installed either on the same system as Home Assistant, also known as HA, or on a different system since it communicates with HA over a network socket. Installation is straightforward, and you can find instructions at https://goo.gl/Hci4zm.
$ sudo pip3 install appdaemon
In the future, you can easily upgrade appdaemon with:
$ sudo pip3 install --upgrade appdaemon
You should also create this systemd service to handle automatic startup:
$ cat /etc/systemd/system/appdaemon.service
[Unit]
Description=AppDaemon
After=homeassistant.service
[Service]
Type=simple
User=homeassistant
ExecStart=/usr/local/bin/appdaemon -c /home/homeassistant/.homeassistant
[Install]
WantedBy=multi-user.target

$ sudo systemctl enable appdaemon
$ sudo systemctl start appdaemon
You will need to create a default configuration preferably inside your HA configuration directory and add a default application to test your setup. The appdaemon.yaml configuration file also stores the credentials to access your Home Assistant instance, or can read them from the file ‘secrets.yaml’.
$ sudo su - homeassistant
$ cat /home/homeassistant/.homeassistant/appdaemon.yaml
 AppDaemon:
 logfile: STDOUT
 errorfile: STDERR
 logsize: 100000
 log_generations: 3
 threads: 10
 HASS:
 ha_url: http://127.0.0.1:8123
 ha_key: !secret api_password
$ mkdir /home/homeassistant/.homeassistant/apps
$ cat /home/homeassistant/.homeassistant/apps/hello.py
import appdaemon.appapi as appapi

#
# Hello World App
#
# Args:
#

class HelloWorld(appapi.AppDaemon):

def initialize(self):
 self.log("Hello from AppDaemon")
 self.log("You are now ready to run Apps!")
The hello.py code above was taken from the installation instructions, but you can find some useful apps in this repository as well at https://goo.gl/6nkzhm. In order to activate and configure an app you will need to add the following inside ‘apps.yaml’:
$ cat /home/homeassistant/.homeassistant/apps.yaml
 hello_world:
 module: hello
 class: HelloWorld
Once you restart AppDaemon, the apps will automatically load. In this case, you should see a "Hello from AppDaemon" message in your logs indicating that the initial setup is done, you can check for this with:
$ sudo journalctl -f -u appdaemon
The best way to get started is to read the documentation. There is a comprehensive tutorial that walks you through all the steps here: https://goo.gl/ha5iC8. Additionally, there is an API reference for quick lookup: https://goo.gl/QeJSYu. The framework is event-driven, so you need to set up listeners for various events that happen in Home Assistant, so your code will be called automatically. You can also access all the states and attributes of Home Assistant entities. When you are familiar with the framework, you can look at the example apps to get an idea how things are done.
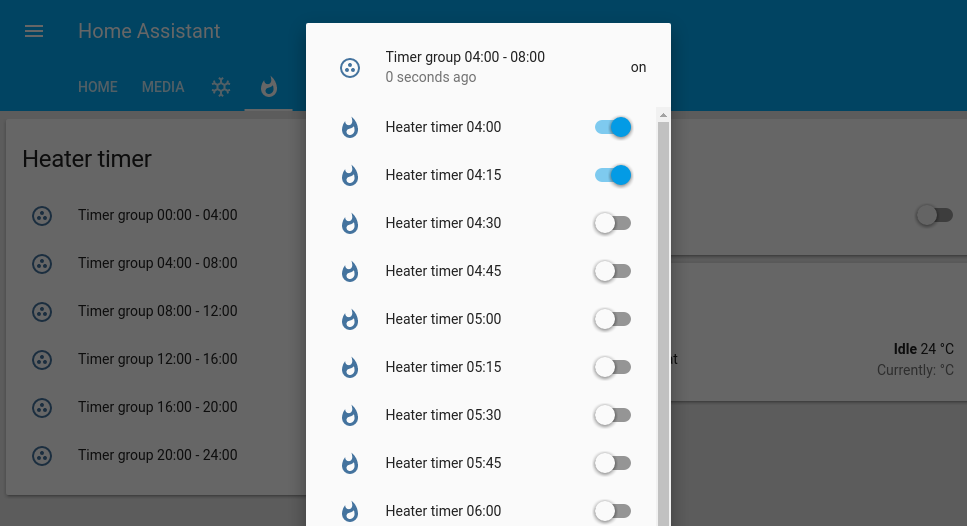
Do you remember the heater project in Home Assistant, published in the last issue of ODROID magazine? Well, maybe because I'm getting older, I feel the need to turn the heat on during certain hours of the day and night, so I wanted to create an app to do it for me. There's a catch though: I want to have some sort of user-friendly switchboard inside Home Assistant to allow me to select at what times I want the heater to be on, as some sort of cron job replacement. I estimated that having 15 minute intervals per switch should be fine, so, if I want to turn the heater on during 4:00 to 4:30, I would need to turn on two switches in the user interface (4:00 and 4:15).
A quick calculation shows us that a day consists of 96 15-minute intervals, and since I'm a lazy person and don't want to write all that configuration code, I made a script to generate the configuration for me (https://goo.gl/DYY5Mj). If you run the script above, it will create 96 input_boolean switches (https://goo.gl/BtJZ41), and distribute them into 4-hour groups. You can then copy/paste this into your configuration file under the relevant sections and restart Home Assistant. Don't forget to add the ‘heater_timer_group’ in the ‘heater’ view:
$ wget https://raw.githubusercontent.com/mad-ady/home-assistant-customizations/master/configuration_helper/make_heater_switches.py
$ python make_heater_switches.py
Configuration.yaml will look something like this:
input_boolean:
 …
 heater_timer_00_00:
 name: Heater timer 00:00
 initial: off
 icon: mdi:fire
 heater_timer_00_15:
 name: Heater timer 00:15
 initial: off
 icon: mdi:fire
 …

group:
 heater_timer_group_0:
 name: Timer group 00:00 - 04:00
 control: hidden
 entities:
 - input_boolean.heater_timer_00_00
 - input_boolean.heater_timer_00_15
 - input_boolean.heater_timer_00_30
 …
 heater_timer_group:
 name: Heater timer
 control: hidden
 entities:
 - group.heater_timer_group_0
 - group.heater_timer_group_1
 - group.heater_timer_group_2
 - group.heater_timer_group_3
 - group.heater_timer_group_4
 - group.heater_timer_group_5

…
 heater:
 name: Gas heater
 view: yes
 icon: mdi:fire
 entities:
 - switch.heater
 - climate.heater_thermostat
 - group.heater_timer_group
You should get the view shown in Figure 1 when done.
In order to give these switches functionality, there has to be some application to listen to their state changes in order to do the desired actions. I've written an code for AppDaemon which does the following:
- On startup, it begins listening for events from input_boolean entities called heater_timer_*, which iterates through all entities and registers a listener for each one.
- When it detects that a boolean has been toggled, it checks if the name of the boolean is the same as the current time, and if yes, controls the heater
- Every minute that the corresponding input_boolean for the current time interval is checked. If it is on, then the heater is turned on.
The full source code is available at https://goo.gl/WGvoAL, and can be installed with the following commands:
$ cd ~homeassistant/.homeassistant/apps/
$ wget \
 https://raw.githubusercontent.com/mad-ady/home-assistant-customizations/master/appdaemon_apps/manual_heater.py
You will also need to edit the apps.yaml file and add the following:
manual_heater:
 module: manual_heater
 class: ManualHeater
 climate: "climate.heater_thermostat"
 heater: "switch.heater"
 interval_length: 15
Now, when you restart AppDaemon the new app will load and will react to the state of your input_booleans. You can follow its progress by reading the AppDaemon's log.
All might seem fine, however, there's a new problem. If you restart HomeAssistant, or if there's a power outage in the middle of the night, all 96 switches will default to the off position. There has to be a way to save their state and have them load the previous state on reboot. Luckily there already is an app for that: switch_reset.py, available at https://goo.gl/LVYdD2. Here's how you can configure it:
$ cd ~homeassistant/.homeassistant/apps/
$ wget -O switch_reset.py \
 https://raw.githubusercontent.com/home-assistant/appdaemon/dev/conf/example_apps/switch_reset.py
$ wget -O globals.py \
 https://raw.githubusercontent.com/home-assistant/appdaemon/dev/conf/example_apps/globals.py
Add the following configuration to apps.yaml:
switch_reset:
 module: switch_reset
 class: SwitchReset
 log: ""
 file: "/home/homeassistant/.homeassistant/switch_states"
 delay: 10
After restarting AppDaemon, the changes to input_boolean, input_number, input_select and device_tracker entities will be stored inside /home/homeassistant/.homeassistant/switch_states, providing our switch state persistence.
Although we’re using automated applications, the major reason why people use AppDaemon is because it provides a dashboard interface so that you can expose and control Home Assistant entities on a touchscreen. Usually people use a TV or a tablet to show the dasboard, but, I've used the HardKernel 3.5" LCD (http://www.hardkernel.com/main/products/prdt_info.php?g_code=G147435282441), with an ODROID-C2 as the computer backend.
In order to enable the dashboard (https://goo.gl/Z8iMW8), you will need to add the following section to appdaemon.yaml:
HADashboard:
 dash_url: http://0.0.0.0:5050
 dash_password: !secret api_password
 dash_dir: /home/homeassistant/.homeassistant/dashboards
The dash_password directive is optional. For ease of use, it's best not to use a password, so that the dashboards can load on boot with no user intervention. You will need to create a sample dashboard under ~homeassistant/.homeassistant/dashboards. Create the directory first, then name it hello.dash:
$ mkdir ~homeassistant/.homeassistant/dashboards
$ mkdir -p \
 /home/homeassistant/.homeassistant/compiled/javascript/css
$ mkdir -p /home/homeassistant/.homeassistant/compiled/css
$ mkdir -p \
 /home/homeassistant/.homeassistant/compiled/html/default
$ cd ~homeassistant/.homeassistant/dashboards
$ vi hello.dash
hello.dash
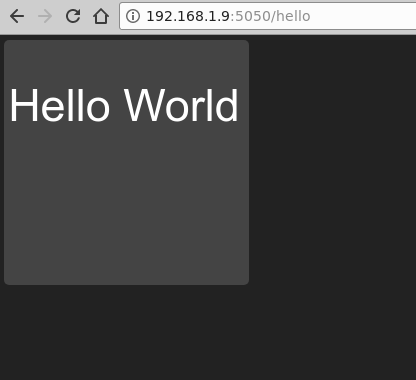
#
# Main arguments, all optional
#
title: Hello Panel
widget_dimensions: [120, 120]
widget_margins: [5, 5]
columns: 8

label:
 widget_type: label
 text: Hello World

layout:
 - label(2x2)
After restarting AppDaemon, you will be able to access this at http://[odroid-ip]:5050/hello, where [odroid-ip] is the IP address of the ODROID-C2.
Dashboards are dynamically generate web pages which can render and control the states of Home Assistant entities. Most entities have corresponding snippets of dashboard configuration, which can control appearances. The reference documentation is available at https://goo.gl/G6iYib.
In order to get started, you need to specify the screen dimensions and think about how you want to divide the screen into widgets. Usually the screen is divided into x*y cells, and each cell has a fixed width and height. You have some flexibility because you can merge cells to create a bigger one, and you can also have empty cells or rows. The standard cell size is 120x120 pixels. Since the 3.5" display has a small resolution (480x320), we'll need to get creative and implement some sort of menu to jump between different dashboards. We will also use small cells, 38x38, with a 1 pixel margin and combine them together to create larger widgets when needed. Note that if you are using a large enough screen you can use, and should use, larger widget sizes to avoid layout issues.
Regarding navigation with a menu, HADashboard has a navigation widget which can be used to load a different dashboard. The plan is to create an 8-item vertical menu which will be imported in all dashboards for quick navigation, then populate the dashboards according to my needs with internal data from Home Assistant, sensors, switches, media players, cameras, and external data such as Netdata Dashboard graphs or online weather. One of the buttons can serve as a menu and load a different dashboard with more buttons, so you have a lot of options.
Here is an example dashboard head that I've duplicated on all dashboards:
#
# Main arguments, all optional
#
title: 3.5in LCD panel - 480x320 divided into 12x8 cells - Home
widget_dimensions: [38, 38]
widget_margins: [1, 1]
columns: 12
use_gass_icon: 1
In order to set up navigation, I've set up a list of "buttons" in a different file called ~homeassistant/.homeassistant/dashboards/navigation-definition.yaml, which is imported in all dashboards and looks like this, just a few items are shown to give you an idea:
home:
 widget_type: navigate
 dashboard: "lcd35-hq"
 icon_active: fa-home
 icon_inactive: fa-home
mpd:
 widget_type: navigate
 dashboard: "mpdkitchen"
 icon_active: fa-music
 icon_inactive: fa-music
tv:
 widget_type: navigate
 dashboard: "tv"
 icon_active: mdi-television-classic
 icon_inactive: mdi-television-classic
 icon_style: "font-size: 1.5em !important;"
 …

extendedmenu:
 widget_type: navigate
 dashboard: "extendedmenu"
 args:
 timeout: 10
 return: lcd35-hq
 icon_active: mdi-menu
 icon_inactive: mdi-menu
You can get a copy of the complete file at https://goo.gl/vwYD33. As you can see, most entries are navigation widgets which get a dashboard file name as a parameter and can have a custom icon or style. The "extendedmenu" item causes that dashboard to be loaded for 10 seconds, then the "lcd35-hq" dashboard is loaded, if there is no other action. This allows you to simulate a popup menu that goes away by itself.
The layout of the widgets on the page is done by creating a layout directive with the rows enumerated below it. For each cell in a row, you would write the widget name as defined in the dashboard, or imported files. Widget names may have their size appended to the name. In order to reuse the configuration as much as possible, you can also import external definitions from other dashboards, like the navigation snippet above. The following snippet is from the main dashboard:
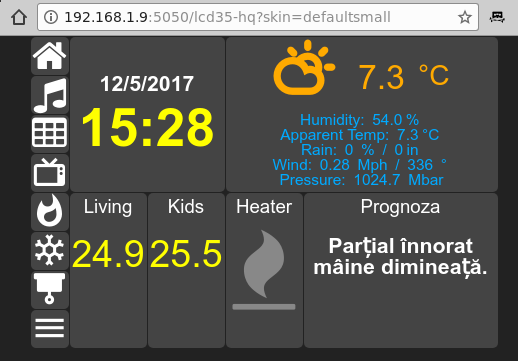
layout:
 - include: navigation-definition
 - include: sensors
 - home, clock(4x4), weather(7x4)
 - mpd
 - webcams
 - tv
 - heating, sensorliving(2x4), sensorkids(2x4), heater(2x4), forecast(5x4)
 - cooling
 - blinds
 - extendedmenu
The leftmost items on the list are the navigation targets defined in the navigation-definition.yaml file. Unfortunately, since I wanted to have a vertical menu, I need to explicitly add them to each dashboard. If I had only a horizontal row, I could have done the layout inside the navigation-definition.yaml file.
The top row begins with a small "home" widget used to navigate back here, then a 4x4 clock widget and a 7x4 weather widget. The next row lists only "mpd", which is part of the menu. The rest of the row is occupied by the big clock and weather widgets, so no new items are appended. Using this logic you can get a mental image of how it's supposed to look. The rest of the items are defined in the dashboard and in the included sensors.yaml, like this:
clock:
 widget_type: clock
 time_format: 24hr
 show_seconds: 0
 time_style: "color: yellow; font-size: 40pt; font-weight: bold;"
 date_style: "font-size: 16pt; font-weight: bold;"

weather:
 widget_type: weather
 units: "°C"
 sub_style: "font-size: 110%; font-weight: bold;"
 main_style: "font-size: 75%; font-weight: bold;"
 unit_style: "font-size: 250%;"

forecast:
 widget_type: sensor
 title: Prognoza
 title_style: "font-size: 14pt;"
 text_style: "font-size: 16pt; font-weight: bold;"
 precision: 0
 entity: sensor.dark_sky_forecast_ro
As you can see, most widgets require an entity which provides the glue to Home Assistant items, a type and the rest of configuration deals with fonts, colors and icons. The icons of various widgets can come from Home Assistant, but can be overridden with icons from Material Design, https://materialdesignicons.com, prefixed with mdi, or from Font Awesome,http://fontawesome.io, prefixed with fa.
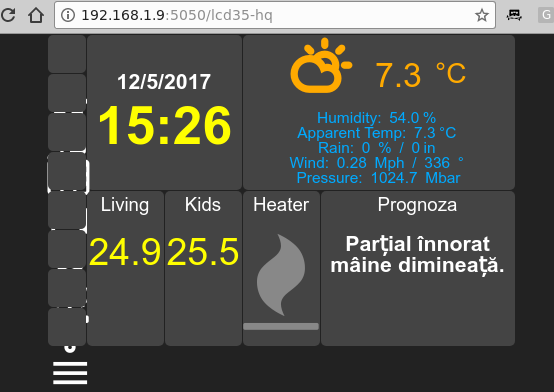
If you were to load this dashboard right now in a browser by navigating to http://odroid-ip:5050/lcd35-hq, it would look like Figure 4.
However, there seems to be a problem with the layout of the navigation widgets. If you were to use Developer Tools in your browser and inspect the layout, you'd see that while the widgets are placed correctly, the icons inherit a CSS style which uses absolute positioning to offset the icon by 43 pixels downward. This is a problem because the dashboard was designed for larger displays with bigger widgets. In order to get around the issue, it's best if we create a skin that loads a custom javascript file that resets the absolute layout of icons and also adjusts the size. In order to do this, you'll need some Javascript, HTML and CSS know-how, but you can get the finished skin from at https://goo.gl/Fwcbti.
$ sudo su - homeassistant
$ cd .homeassistant/
$ mkdir -p custom_css/defaultsmall
$ cd custom_css/defaultsmall
$ wget -O dashboard.css \
 https://raw.githubusercontent.com/mad-ady/home-assistant-customizations/master/appdaemon_skins/defaultsmall/dashboard.css
$ wget -O dashboardsmall.js \
 https://raw.githubusercontent.com/mad-ady/home-assistant-customizations/master/appdaemon_skins/defaultsmall/dashboardsmall.js
$ wget -O variables.yaml \
 https://github.com/mad-ady/home-assistant-customizations/blob/master/appdaemon_skins/defaultsmall/variables.yaml
Now, if you reload the dashboard and specify an explicit skin you'll get much better results (http://[odroid-ip]:5050/lcd35-hq?skin=defaultsmall)
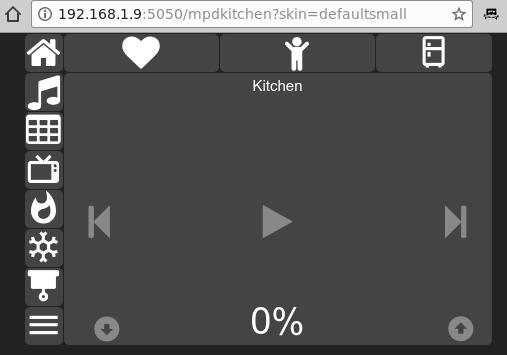
Now you can take a look at my dashboards. All the configuration is at https://goo.gl/VuB9sr. The MPD dashboard consists of 3 similar dashboards that I can cycle through by using the top navigate widgets. They load 3 different MPD instances around the house. The difference between the dashboards are just the instance loaded (see mpdkitchen below). The dashboard's layout is pretty simple:
layout:
 - include: navigation-definition
 - include: mpd
 - home, navigationmpdliving(4x1), navigationmpdkids(4x1), navigationmpdkitchen(3x1)
 - mpd, mpdkitchen(11x7)
 - webcams
 - tv
 - heating
 - cooling
 - blinds
 - extendedmenu
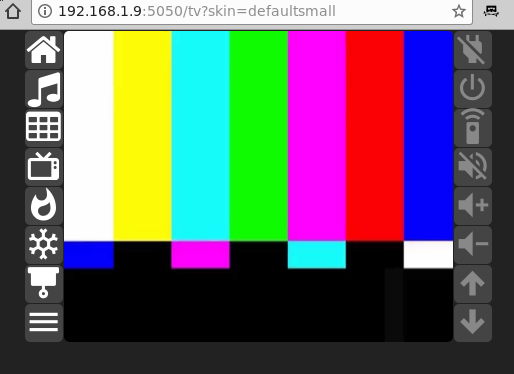
I also have a dashboard view to control my TV, which was imported in Home Assistant as described at https://magazine.odroid.com/article/home-assistantscripts-customization/. We are getting the image from a camera component inside Home Assistant and using the Camera Widget. The buttons are used to control the virtual remote and connect to script components in Home Assistant as well as to the script entity in HADashboard. An example for layout and widgets can be found below:
layout:
 - include: navigation-definition
 - home, streamtv(10x8), tv_living_off
 - mpd, tv_living_on
 - webcams, tv_living_source
 - tv, tv_living_mute
 - heating, tv_living_volume_up
 - cooling, tv_living_volume_down
 - blinds, tv_living_ch_up
 - extendedmenu, tv_living_ch_down

streamtv:
 widget_type: camera
 entity_picture: http://192.168.1.4:8123/api/camera_proxy/camera.tv_living_image?token=62f78994c790a89459e2f60cc6ed80bdfce3e9b5ff5473633ba60e3d7089f0a6&api_password=odroid
 refresh: 2

tv_living_off:
 widget_type: script
 entity: script.tv_living_power_off
 icon_on: mdi-power-plug-off
 icon_off: mdi-power-plug-off

tv_living_on:
 widget_type: script
 entity: script.tv_living_power_on
 icon_on: mdi-power
 icon_off: mdi-power
What's different about the camera widget is that it requires a URL via Home Assistant's API. This URL has to include the API key and also a token which is visible in Home Assistant -> Entities view for the entity in question. If you also use a password to access Home Assistant, you'll need to append the password to the URL. Figure 7 shows you the end result.
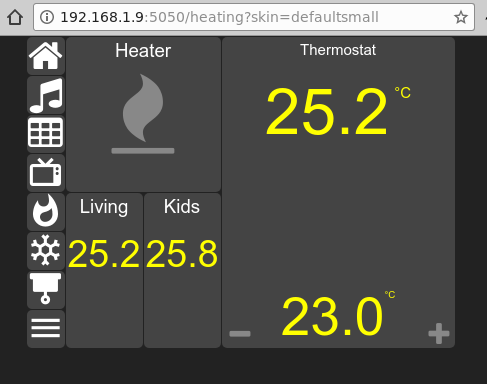
Another dashboard allows you to control the heater, manually, and the thermostat. The configuration for the thermostat widget looks like this, and the end result is in Figure 8.
layout:
 - include: navigation-definition
 - include: sensors
 - home, heater(4x4), thermostat(6x8)
 - mpd
 - webcams
 - tv
 - heating, sensorliving(2x4), sensorkids(2x4)
 - cooling
 - blinds
 - extendedmenu

thermostat:
 widget_type: climate
 title: Thermostat
 step: 0.5
 precision: 1
 entity: climate.heater_thermostat
 unit_style: "color: yellow;"
 level_style: "color: yellow; font-size: 48pt;"
 unit2_style: "color: yellow;"
 level2_style: "color: yellow; font-size: 40pt;"
 level_up_style: "font-size: 20pt;"
 level_down_style: "font-size: 20pt;"
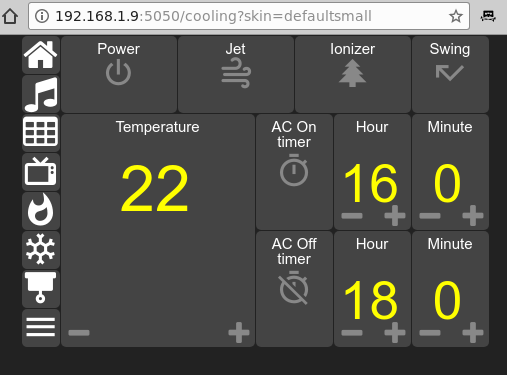
During the summer, the Cooling dashboard will see some use. Here are placed the sensors, switches and timers that control the AC system, as described in https://magazine.odroid.com/article/home-assistantscripts-customization/ . The dashboard looks like Figure 9.
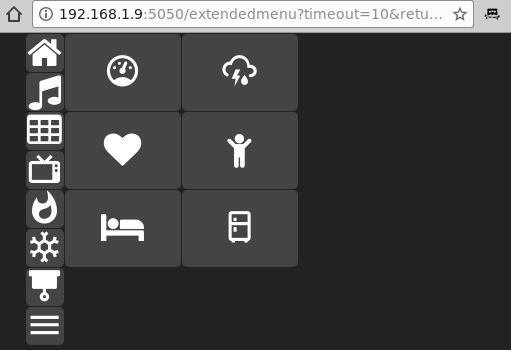
The extended menu is nothing more than a dashboard with more navigate widgets. In it, I have links to a Netdata dashboard and an Hourly forecast and images from my webcams, with room for more in the future.
The Hourly Weather forecast dashboard makes use of the iframe widget to load a URL, while the Netdata Dashboard cycles through a list of URLs every 5 seconds:
mynetdata:
 widget_type: iframe
 refresh: 5
 url_list:
 - http://192.168.1.5:19999/server1.html
 - http://192.168.1.5:19999/server2.html
 - http://192.168.1.5:19999/server3.html
 - http://192.168.1.5:19999/server4.html
 - http://192.168.1.5:19999/server5.html
Now that the dashboard is working to your liking, you'll have to invest a bit of time on the display side. You can start with @FourDee's installation script for the display at https://forum.odroid.com/viewtopic.php?t=24248. You will also need to enable autologin inside lightdm (https://wiki.odroid.com/accessory/display/3.5inch_lcd_shield/autox#auto_login). Once this is done, it's time for some cleanup. It's best to remove programs that display popups on screen, like the Update Manager and screensaver:
$ sudo apt-get remove update-manager gnome-screensaver
We will also prepare a script that runs Chromium in Kiosk mode, with no password store, so that it won't ask you every time to unlock your password store. Chromium will also be set up with a fix that makes it forget it crashed, so in case of an unclean shutdown, it won't ask you if you want to restore the previous session. In addition to this, we'll set the monitor to always on:
$ cat /usr/local/bin/kiosk-mode.sh
#!/bin/bash
/usr/bin/xset s off
/usr/bin/xset -dpms
/usr/bin/xset s noblank
/bin/sed -i 's/"exited_cleanly": false/"exited_cleanly": true/' ~/.config/chromium/Default/Preferences
dashboard=lcd35-hq
/usr/bin/chromium-browser --noerrdialogs --incognito --password-store=basic --kiosk http://odroid-ip:5050/$dashboard?skin=defaultsmall
$ sudo chmod a+x /usr/local/bin/kiosk-mode.sh
You can also add the Scrollbar Anywhere Chrome extension (https://goo.gl/UD3hDA). Configure it to react to the left button and enable "Use Grab-and-drag style scrolling" so that you can scroll, if needed, with your finger on the dashboard.
Test that the script is working correctly when started from the graphical environment, and when ready, you can add it to the list of autostarted applications in Control Center -> Personal -> Startup Applications. Just click “add”, use "Kiosk mode" for the name, and /usr/local/bin/kiosk-mode.sh as the command. Once you restart lightdm, you should see a full screen dashboard.
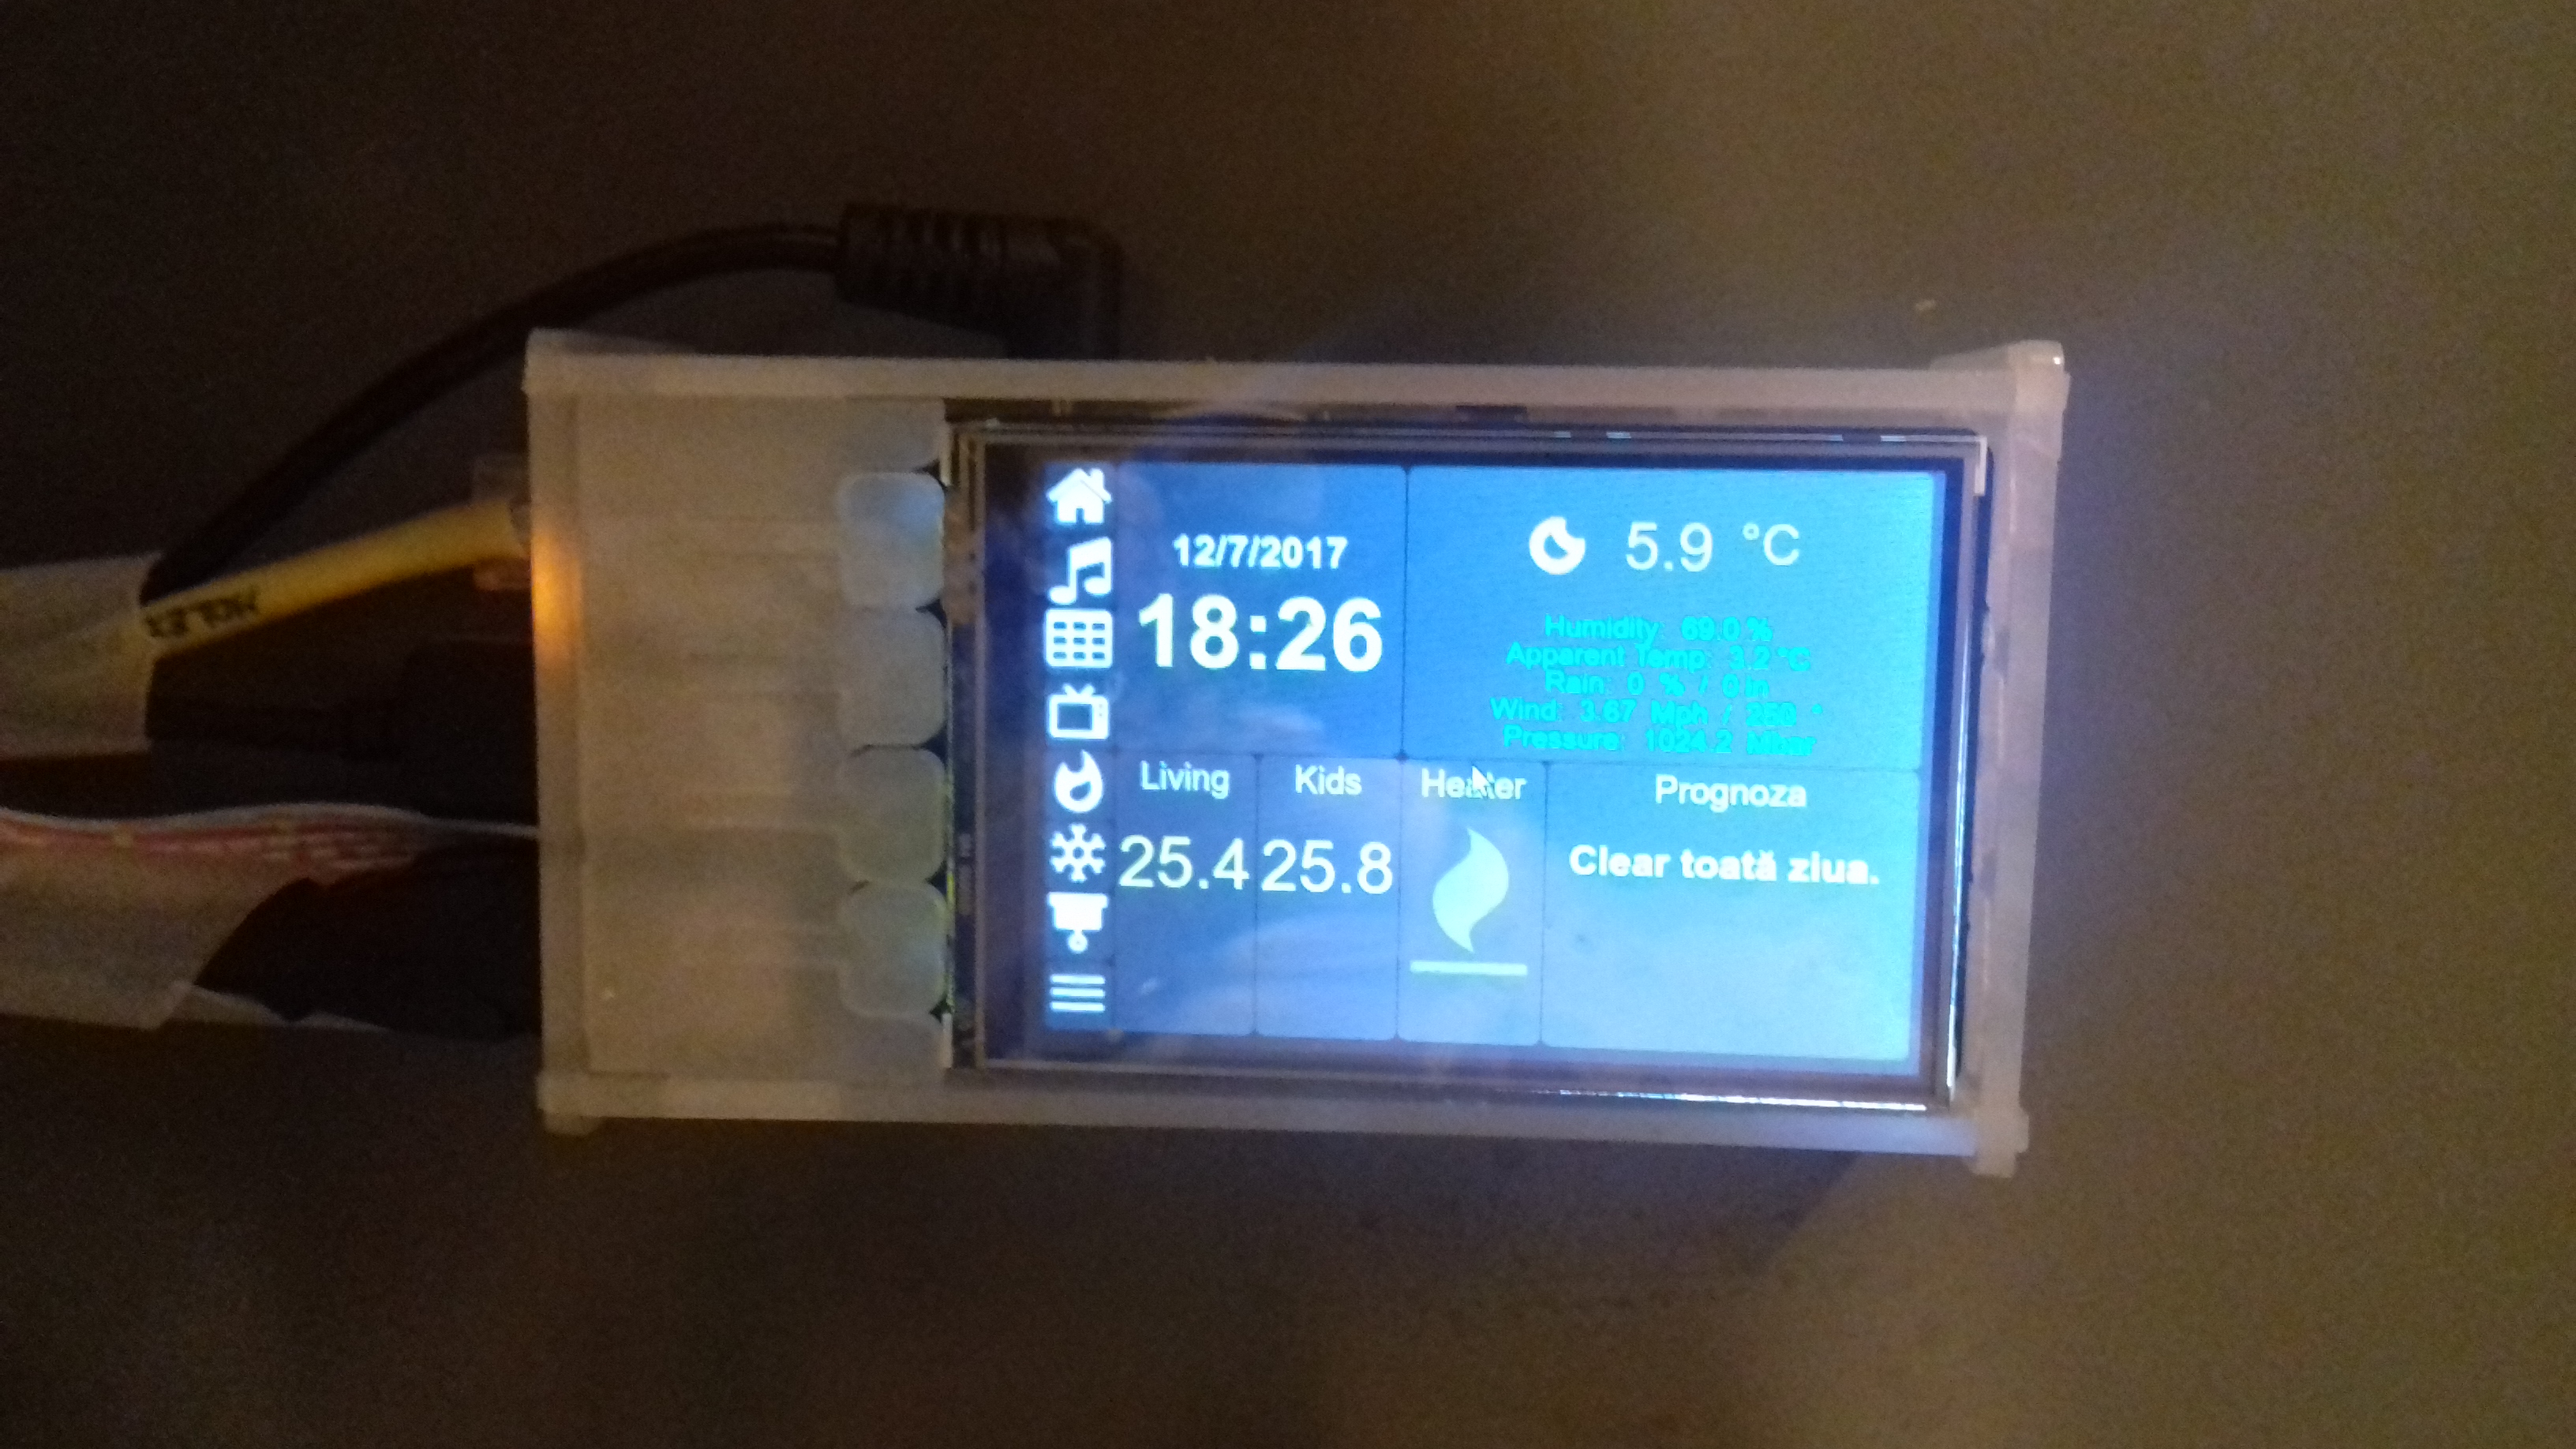
Show in Figure 11 is the end result, running on the 3.5" display. Hardkernel's 3.5" display is perfect for a small dashboard. The font sizes and colors used are optimized for easy reading from 2-3 meters away and the contrast helps with reading from wider angles. The display's low refresh rate of 10 fps is not noticeable with the dashboard.
You can get the dashboard configuration files from the GitHub project at https://github.com/mad-ady/home-assistant-customizations, and view a demonstration video at youtu.be/fEoHs3-_3B0. Please note that they were tested with appdaemon 2.1.12, but version 3 is currently under development ,and by the time you implement this, some things may have changed slightly. Keep an eye on the GitHub repository and on the support thread at https://forum.odroid.com/viewtopic.php?t=27321.
Be the first to comment