

I have created the Info and Monitoring Tool for CloudShell2 and wish to share it with the community. I use it with OpenMediaVault and thus it is only tested in Debian, however it should work also in Ubuntu.
The image can be downloaded from the link listed below. You have to install all the latest updates which includes a kernel update from 4.9 to 4.14 via the admin interface.

Illustration
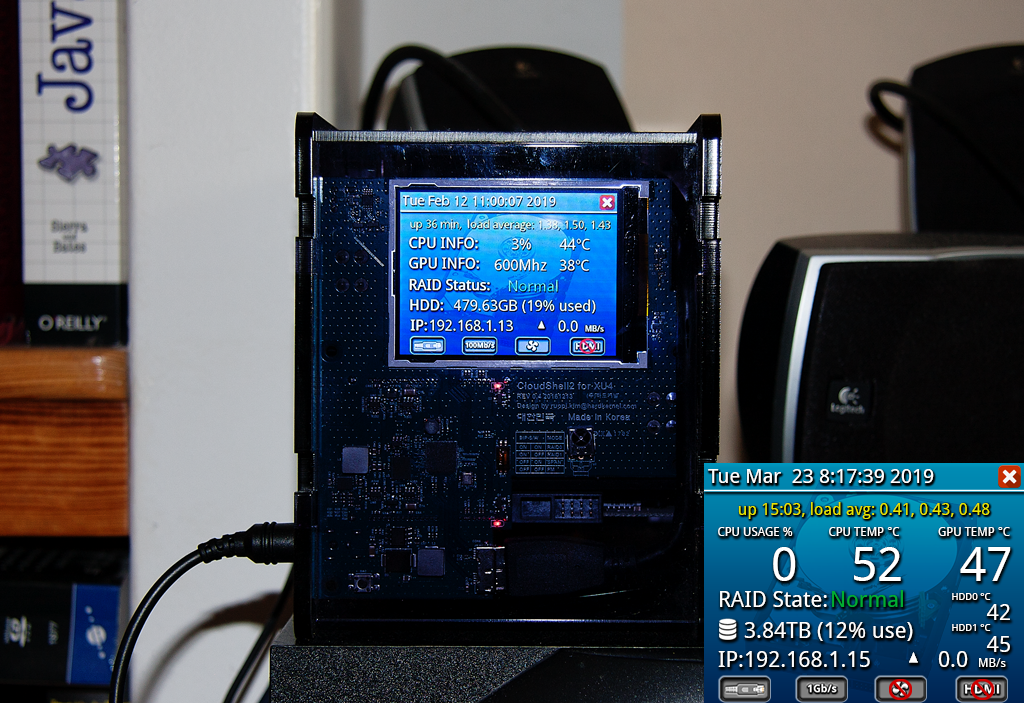
The main focus was to provide a view in which information can be easily read by using a larger font like those used by other tools.
The RAID Status, current time, up time, average usage, current IP address and free space are just some of the information you can get. On the bottom you have four icons; from the left they are:
- Ethernet cable connection status
- Recognised Ethernet connection speed
- Fan ON/OFF status
- HDMI cable connection status
The CloudShell2_lcd tool monitors the Raid status and temperature. It has two temperature triggers, one which to switch the CloudShell2 off and send an email notification to the user if a certain temperature is reached for a certain time (default 85°C for 15 seconds). The second one regulates the case fan of the CloudShell2, by default it will switch the fan on if the XU4 reaches a temperature >65°C and off if a temperature <60°C (65-5) is held for a period of 5 minutes. All relevant scripts for sending mail and startup are installed in /usr/local/bin
$ raid_mailsend
$ start-lcd
$ temperature_shutdown
Within the admin interface of OpenMediaVault (OMV) you have to enable mail notification. In case of HW/RAID errors, they are reported along with everything else that is problematic or, alternatively, just information on the system will be reported. [caption id="attachment_11863" align="alignnone" width="790"]
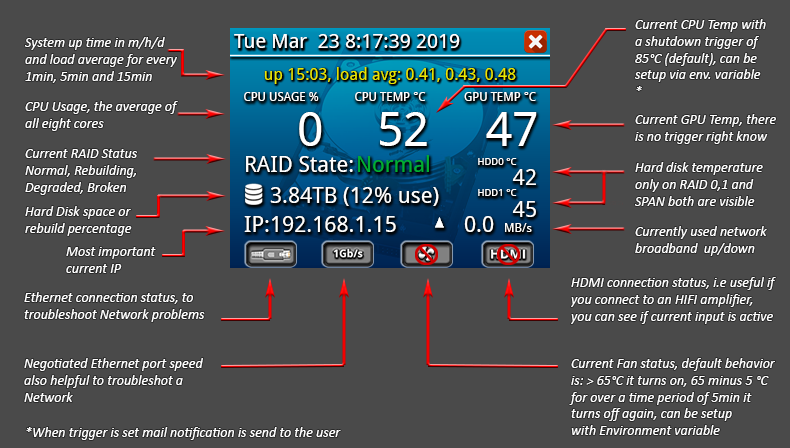 Figure 3 - CloudShell2 Illustration[/caption]
XU4 and XU4Q are different from here what values could be used, on an XU4 (without SoC fan) it could be that you are better by setting up the fan to be always on, but the default values should be good enough for average daily work.
Installation
Activate the LCD:
$ wget https://github.com/seungchar/odroid-cloudshell/raw/master/odroid-cloudshell_20170420-4_armhf.deb
$ sudo dpkg -i odroid-cloudshell_20170420-4_armhf.deb
Install dependencies:
$ sudo apt-get install libfreetype6 systatFinally, install the LCD Info and Monitoring tool. The LCD driver should already be running; load it manually or do a reboot here.
$ wget http://www.areascout.at/cloudshell2-monitoring_1.0.7-2_armhf.deb
$ sudo dpkg -i cloudshell2-monitoring_1.0.7-2_armhf.deb
Have fun with a new display look!
You can now continue to setup the RAID controller with the DIP switches on front of your CloudShell2. After that you have to mount the newly created hard disk RAID set within the admin interface of OMV.
The HW RAID setup guide can be downloaded from here: https://goo.gl/pwWm49
You would have to skip step 2 and 3 of that guide.
Environment Variables
Both temperature and hysteresis (time period) can be setup individually via environment variables.
NETIF : The Network Interface name i.e eth0, it is detected automatically by the LCD Tool start script but if that fails it can be setup manually.
MAX_CPU_TEMP : CloudShell2 shutdown temperature ( default MAX_CPU_TEMP=85 ).
CPU_TEMP_HYSTERESIS : How long in seconds has the MAX_CPU_TEMP occurred to switch the CloudShell2 off ( default CPU_TEMP_HYSTERESIS=15 ).
FAN_ON_TEMP : Temperature when the case fan should switch on ( default FAN_ON_TEMP=65 ).
FAN_OFF_HYSTERESIS : Time, in seconds, when FAN_ON_TEMP minus 5°C has to be reached to switch the fan off again ( default FAN_OFF_HYSTERESIS=300 ).
CS_HDD_MOUNTP : Unique mountpoint or device path to display the hard disk space, i.e if you are using an complex LVM config.
Example:
Export environment variables inside the /usr/local/bin/start-lcd script:
#!/bin/bash
export NETIF=$(ls /sys/class/net -I lo)
export FAN_ON_TEMP=0
echo 0 > /sys/class/graphics/fbcon/cursor_blink
echo none > /sys/class/leds/blue\:heartbeat/trigger
/usr/local/bin/CloudShell2_lcd
This will setup the fan to be always on, there are several ways to declare environment variables this is just one way:
$ sudo systemctl restart cloudshell2-monitoringor a reboot could be needed
The tool also has a new command line option -i which you can invoke to get more information about your raid controller and disks connected; you can execute it at any time, even if the tool is already running:
$ CloudShell2_lcd -iHave fun.
Disclaimer: I am in no way responsible for any damage to your cloudshell2. Please always keep in mind what you are doing it for tinkering/experimenting only!
Be the first to comment